SENSOR-TO-DASHBOARD Pemberton Digital mmWave Sensor

privacy-first
occupancy analytics.

  • Footfall & Occupancy
  • Queue Analytics
  • Merchandising Analytics

Pemberton Digital transforms anonymous movement into actionable operational intelligence. Our mmWave sensors capture how people interact with physical spaces — no cameras, no images, and without collecting personal data.

TRUSTED BY
Pemberton Digital mmWave Sensor

Real Deployments,
Measurable Results.

From single-site projects to multi-site rollouts — privacy-first mmWave sensing deployed across retail, hospitality and shopping precincts.

Pets at Home
Retail · Merchandising Analytics
Merchandising Analytics with Pets at Home

mmWave occupancy sensors deployed to capture customer flow and dwell — tracked on a digital floor plan with insights delivered via dashboards and reporting.

Pets at Home is continuously investing in its sites to improve the in-store experience for customers. Recently, the group introduced a range of Pets-branded merchandising fixtures and engagement points, including product spotlights and interactive screens.

However, Pets at Home had no data on which fixtures customers found engaging and which were less appealing. The group did not want an expensive camera-based system and instead opted for Pemberton Digital's privacy-first, radar-based solution to measure customer interactions in store.

Pemberton Digital deployed mmWave advanced occupancy sensors at strategic locations in store to capture customer flow and dwell. The client-facing product was a digital floor plan and dashboard, reporting key appeal metrics:

  • Impressions – the number of customers who passed the fixture
  • Engagement – the number of customers who paused at the fixture
  • Browse time – the average time customers spent at the fixture

The Result

Using real data captured in store, Pets at Home gained a clear view of how its merchandising and engagement points were performing. This insight allows the business to continuously refine in-store features and make better-informed decisions about which fixtures to include in future refits, improving the customer experience while avoiding unnecessary spend.

Why It Works

Pemberton's solution met Pets at Home's requirements around privacy, scale and cost, providing access to behavioural data that had previously been difficult to capture. The underlying technology is well suited to large, open-plan trading areas, making it a practical and deployable solution for Pets at Home's large-format stores.

YO! Sushi
Hospitality · Table Analytics
Table & Seating Analytics with YO! Sushi

Ceiling-mounted occupancy sensing mapped to a digital seating plan — capturing dine duration, group size and seating preference, in addition to wider busyness metrics.

YO! Sushi needed insight into customer preference and busyness across its dine-in locations. Due to the restaurant format, key factors such as dine time, group size, seating preference and utilisation were difficult to measure, leaving gaps in understanding both the in-store experience and day-to-day operations.

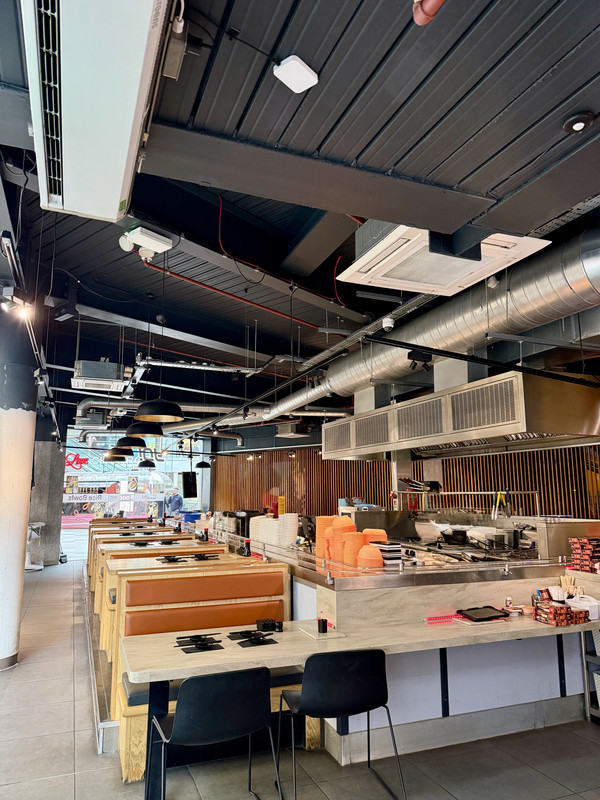
To capture these metrics, Pemberton Digital deployed a ceiling-mounted occupancy sensing system, mapping each seating location to a digital floor plan. Presence at each location—whether booths or stools—was recorded to Pemberton's cloud analytics platform for reporting and analysis. YO! Sushi now has access to automated reporting, APIs and data exports, enabling insights to be combined with existing POS and commercial data.

  • More than door counting – richer analytics for in-store activity
  • Discreet and zero-touch – 100% private by design
  • Sensor to inbox – automated analytics and reporting

The Result

YO! Sushi now has visibility into dine duration, group size, seating preference and the utilisation and underutilisation of different seating types. Rather than providing a single snapshot, the data is time-mapped across trading weeks and months, delivering a more holistic view of store performance and trends. This allows YO! Sushi to make site-specific adjustments to product, stock and staffing, improving overall operations and sales while minimising waste, resource use and labour spend.

Why It Works

The solution delivers accurate, seat-level in-store analytics without the use of cameras or personal data, meeting requirements around privacy, scale and cost. Its ability to operate reliably across busy, open dining environments enables consistent customer counting and occupancy measurement over time, providing actionable behavioural insight through a simple, low-friction deployment.

Epsom Social Food Hall
Hospitality · Venue Analytics
Multi-Sensor Venue Analytics with Epsom Social

mmWave sensors deployed across a 7,000 sq ft food hall — delivering whole-site coverage with heat mapping, zone analytics, customer flow and occupancy in a single dashboard view.

Epsom Social Food Hall required a comprehensive understanding of how customers used its 7,000 sq ft venue throughout the day. The objective was to generate operational insight across the whole site rather than simply count visitors at the door.

Pemberton Digital deployed a network of mmWave sensors to achieve near whole-site coverage, enabling several analytics capabilities to operate simultaneously:

  • People counting at entry and exit points
  • Customer flow mapping to understand how visitors moved through the venue
  • Zone analytics measuring occupancy, dwell time, entries and exits across different areas
  • Heat mapping to visualise high-traffic and low-traffic zones across the full floor
  • External footfall monitoring to capture pedestrian traffic in the surrounding precinct

The Result

Management gained a data-driven view of the venue enabling them to optimise layout, improve staffing allocation, understand peak trading periods and measure how different areas contributed to customer engagement. External vs internal footfall comparison revealed conversion opportunities that had previously been invisible.

Why It Works

The deployment demonstrated Pemberton's ability to stitch data from multiple sensors into a single analytics view, creating a digital representation of movement across a large, open-plan hospitality environment — a strong reference for food halls, leisure venues and any public space requiring whole-site visibility.

K10
QSR · Queue Analytics
Queue Busting with K10

A single ceiling-mounted mmWave sensor tracking footfall, queue length, wait time and peel-off — with trend reporting and alerts via a central dashboard.

K10 is a quick-service restaurant chain serving the City of London's lunchtime rush. With a narrow service window, maximising throughput and conversion is critical to success.

As operators like K10 scale across multiple locations, maintaining visibility at site level becomes a challenge. Multi-site managers are stretched between stores, making it harder to intuit busyness, manage queues and optimise staffing. Reliable data is required to plan and resource effectively.

Pemberton Digital deployed a queue detection and reporting solution using a single ceiling-mounted mmWave sensor positioned above the service counter and within reach of the store entrance. The system:

  • Tracks footfall and total occupancy
  • Measures queue length, customer wait time and peel-off
  • Reports trends, anomalies and alerts via a central dashboard

Why It Works

Recognising and addressing service bottlenecks improves throughput, margins and profitability, particularly during compressed service windows. Pemberton's lightweight, cost-effective and fully private solution operates independently of existing store systems, making it a practical alternative to video-based solutions, which are often costly and overbuilt for most hospitality environments.

Sensor to dashboard,
for better visibility.

Six core capabilities. One integrated platform. Every component is designed to work together — from sensing hardware through to cloud analytics and reporting.

Merchandising Analytics

Understand how customers interact with promotional displays, branded fixtures and product launches. Measure impressions, dwell and engagement to evaluate campaign effectiveness and optimise in-store investment.

Display EngagementDwellCampaign Performance
Footfall & Occupancy

Accurate entry and exit counting with real-time occupancy monitoring. Track total visitors, hourly and daily trends, and compare performance across locations — all without capturing a single image.

People CountingOccupancyTraffic Analysis
Queue Analytics

Monitor queue formation in real time. Measure queue length, wait time, service time and abandonment — with instant alerts when thresholds are exceeded and trend reporting to identify peak periods.

Queue MonitoringWait TimeAbandonment
Heat Mapping & Zone Analytics

Visualise customer movement across your space and define virtual zones to measure occupancy, dwell and utilisation. Identify high-traffic areas, pinch points and underutilised zones — no physical barriers required, zones reconfigurable remotely.

Heat MapsVirtual ZonesDwell & Utilisation
Dashboard & Reporting

Live occupancy, historical analytics, cross-site comparison and automated reporting — all in one platform. API access, CSV exports and Power BI integration connect your data to existing business intelligence systems.

Live DashboardPower BIAPI & Exports
Privacy-First Sensing

No cameras. No images. No personally identifiable information. Our mmWave sensors detect and track anonymous moving objects, delivering all the insight of video analytics without any of the privacy risk. GDPR compliant by design.

No PIIGDPR CompliantmmWave

From survey to live insight.

Simple installation, fast deployment, minimal infrastructure requirements. Most sites are live within a single visit.

01
Survey

We assess your site, understand your operational questions and identify where sensing will deliver the most value. Every deployment is scoped to a specific use case and measurable outcome.

02
Configure

Sensor placement is designed and the analytics platform is configured to your specific zones, reports, alerts and thresholds — before we arrive on site.

03
Deploy

Installation is carried out by our network of accredited contractors, keeping disruption to a minimum. Pemberton manages all technical configuration, calibration and cloud connectivity remotely.

04
Insight

Live data flows immediately. Dashboards, automated reports, exports and alerts are configured and handed over to your team — ready to inform decisions from day one.

Let's get to work.

Book a demo to see the platform live, or bring us a site and we'll outline a deployment plan.